
Problem Statement:
As a developer or user, I would like to make an informed decision by fetching the AEM system CPU/Heap status before or while running a process.
Introduction:
Use cases for developers:
- Infinite loops – a coding error
- Garbage collection is not handled – unclosed streams
- An exception like out of bound issue
- Heap size issue – saving loads of data or declaring/manipulating too many strings
Java MX Bean is an API that provides detailed information on JVM CPU/MEM (Heap) status.
A platform MXBean is a managed bean that conforms to the JMX Instrumentation Specification and only uses a set of basic data types. A JMX management application and the platform MBeanServer can interoperate without requiring classes for MXBean specific data types. The data types being transmitted between the JMX connector server and the connector client are open types and this allows interoperation across versions. See the specification of MXBeans for details.
Each platform MXBean is a PlatformManagedObject and it has a unique ObjectName for registration in the platform MBeanServer as returned by the getObjectName method.
As developer before running or while running any bulk process or schedulers, it’s always better to get system information.
ThrottledTaskRunnerStats Service:
Create ThrottledTaskRunnerStats service as shown below:
package com.aem.operations.core.services;

import javax.management.InstanceNotFoundException;
import javax.management.ReflectionException;

/**
 * Private interface for exposing ThrottledTaskRunner stats
 * **/
public interface ThrottledTaskRunnerStats {
    /**
     * @return the % of CPU being utilized.
     * @throws InstanceNotFoundException
     * @throws ReflectionException
     */
    double getCpuLevel() throws InstanceNotFoundException, ReflectionException;

    /**
     * The % of memory being utilized.
     * @return
     */
    double getMemoryUsage();

    /***
     * @return the OSGi configured max allowed CPU utilization.
     */
    double getMaxCpu();

    /***
     * @return the OSGi configured max allowed Memory (heap) utilization.
     */
    double getMaxHeap();

    /**
     * @return the max number of threads ThrottledTaskRunner will use to execute the work.
     */
    int getMaxThreads();
}
ThrottledTaskRunnerImpl Service Implementation:
Create ThrottledTaskRunnerImpl service implementation as shown below:
package com.aem.operations.core.services.impl;

import java.lang.management.ManagementFactory;
import javax.management.Attribute;
import javax.management.AttributeList;
import javax.management.AttributeNotFoundException;
import javax.management.InstanceNotFoundException;
import javax.management.MBeanException;
import javax.management.MBeanServer;
import javax.management.MalformedObjectNameException;
import javax.management.ObjectName;
import javax.management.ReflectionException;
import javax.management.openmbean.CompositeData;
import com.aem.operations.core.services.ThrottledTaskRunnerStats;
import org.osgi.service.component.annotations.Activate;
import org.osgi.service.component.annotations.Component;
import org.osgi.service.component.annotations.Modified;
import org.slf4j.Logger;
import org.slf4j.LoggerFactory;

@Component(service = ThrottledTaskRunnerStats.class, immediate = true, name = "Throttled Task Runner Service Stats")
public class ThrottledTaskRunnerImpl implements ThrottledTaskRunnerStats {

    private static final Logger LOGGER = LoggerFactory.getLogger(ThrottledTaskRunnerImpl.class);
    private final MBeanServer mbs = ManagementFactory.getPlatformMBeanServer();
    private ObjectName osBeanName;
    private ObjectName memBeanName;

    @Activate
    @Modified
    protected void activate() {
        try {
            memBeanName = ObjectName.getInstance("java.lang:type=Memory");
            osBeanName = ObjectName.getInstance("java.lang:type=OperatingSystem");
        } catch (MalformedObjectNameException | NullPointerException ex) {
            LOGGER.error("Error getting OS MBean (shouldn't ever happen) {}", ex.getMessage());
        }
    }

    @Override
    public double getCpuLevel() throws InstanceNotFoundException, ReflectionException {
        // This method will block until CPU usage is low enough
        AttributeList list = mbs.getAttributes(osBeanName, new String[]{"ProcessCpuLoad"});

        if (list.isEmpty()) {
            LOGGER.error("No CPU stats found for ProcessCpuLoad");
            return -1;
        }

        Attribute att = (Attribute) list.get(0);
        return (Double) att.getValue();
    }

    @Override
    public double getMemoryUsage() {
        try {
            Object memoryusage = mbs.getAttribute(memBeanName, "HeapMemoryUsage");
            CompositeData cd = (CompositeData) memoryusage;
            long max = (Long) cd.get("max");
            long used = (Long) cd.get("used");
            return (double) used / (double) max;
        } catch (AttributeNotFoundException | InstanceNotFoundException | MBeanException | ReflectionException e) {
            LOGGER.error("No Memory stats found for HeapMemoryUsage", e);
            return -1;
        }
    }

    @Override
    public double getMaxCpu() {
        return 0.75;
    }

    @Override
    public double getMaxHeap() {
        return 0.85;
    }

    @Override
    public int getMaxThreads() {
        return Math.max(1, Runtime.getRuntime().availableProcessors()/2);
    }
}
CPU Status Servlet:
Create a CpuStatusServlet based on the path as shown below:
package com.aem.operations.core.servlets;

import java.io.IOException;
import java.io.PrintWriter;
import java.text.MessageFormat;
import javax.management.InstanceNotFoundException;
import javax.management.ReflectionException;
import javax.servlet.Servlet;
import javax.servlet.ServletException;
import com.aem.operations.core.services.ThrottledTaskRunnerStats;
import org.apache.sling.api.SlingHttpServletRequest;
import org.apache.sling.api.SlingHttpServletResponse;
import org.apache.sling.api.servlets.SlingAllMethodsServlet;
import org.osgi.service.component.annotations.Component;
import org.osgi.service.component.annotations.Reference;
import org.slf4j.Logger;
import org.slf4j.LoggerFactory;
import com.google.gson.Gson;
import com.google.gson.JsonObject;

@Component(service = { Servlet.class }, property = { "sling.servlet.paths=" + CpuStatusServlet.RESOURCE_PATH,
        "sling.servlet.methods=POST" })
public class CpuStatusServlet extends SlingAllMethodsServlet{

    private static final Logger LOGGER = LoggerFactory.getLogger(CpuStatusServlet.class);

    private static final long serialVersionUID = 1L;
    public static final String RESOURCE_PATH = "/bin/cpustatust";
    private static final String MESSAGE_FORMAT = "{0,number,#%}";

    @Reference
    private transient ThrottledTaskRunnerStats ttrs;

    @Override
    protected void doGet(SlingHttpServletRequest request, SlingHttpServletResponse response)
            throws ServletException, IOException {
        JsonObject jsonResponse = getSystemStats();
        try (PrintWriter out = response.getWriter()) {
            out.print(new Gson().toJson(jsonResponse));
        }
    }

    private JsonObject getSystemStats() {
        JsonObject json = new JsonObject();
        try {
            json.addProperty("cpu", MessageFormat.format(MESSAGE_FORMAT, ttrs.getCpuLevel()));
        } catch (InstanceNotFoundException | ReflectionException e) {
            LOGGER.error("Could not collect CPU stats {}", e.getMessage());
            json.addProperty("cpu", -1);
        }
        json.addProperty("mem", MessageFormat.format(MESSAGE_FORMAT, ttrs.getMemoryUsage()));
        json.addProperty("maxCpu", MessageFormat.format(MESSAGE_FORMAT, ttrs.getMaxCpu()));
        json.addProperty("maxMem", MessageFormat.format(MESSAGE_FORMAT, ttrs.getMaxHeap()));
        return json;
    }
}
Frontend:
Make a request to a servlet from frontend using AJAX call as shown below:
function getStatus(showStatus) {
   $.ajax({
      // add the servlet path
      url: "/bin/cpustatust",
      method: "GET",
      async: true,
      cache: false,
      contentType: false,
      processData: false
   }).done(function (data) {
      if (data) {
         data = JSON.parse(data);
         $("#table-body").append(`<tr>
						<td>${data.cpu}/${data.maxCpu}</td>
			            <td>${data.mem}/${data.maxMem}</td>
		           		 </tr>`);
      } else {
         $(".modal").hide();
         showStatus = false;
         ui.notify("Error", "Unable to get the status", "error");
      }
   }).fail(function (data) {
      $(".modal").hide();
      showStatus = false;
      if (data && data.responseJSON && data.responseJSON.message) {
         ui.notify("Error", data.responseJSON.message, "error");
      } else {
         //add error message
         ui.notify("Error", "Unable to get the status", "error");
      }
   });
   if (showStatus) {
      setTimeout(() => {
         emptyResults();
         getStatus(true);
      }, 2000);
   }
}
function emptyResults() {
   $("#table-body").empty();
}
<table id="table-data">
   <thead id="table-head">
   <tr>
      <th>CPU Usage</th>
      <th>Memory (Heap) Usage</th>
   </tr>
   </thead>
   <tbody id="table-body">
   </tbody>
</table>
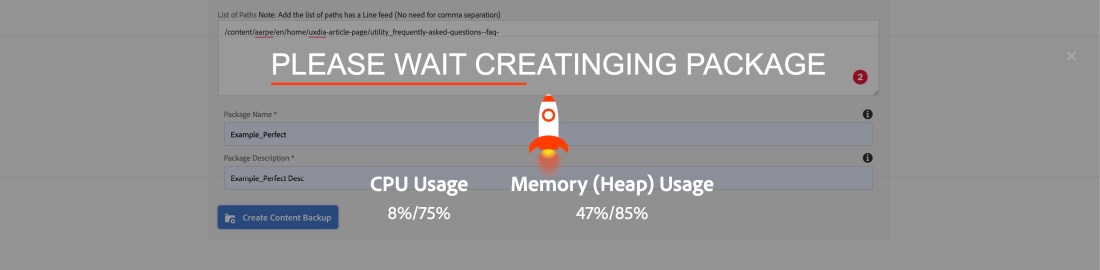
The output of the status:

For more information on Throttled Task runner-based performance optimization please visit:
