Can I perform incremental builds on the Maven project?
Introduction:
Gradle AEM Plugin (GAP) developed by Wunderman Thompson Technology uses Gradle as a building tool.
Advantages of Gradle: 1. Flexibility
2. Performance
Incrementality — tracks the tasks, watches file changes and runs only what is necessary.
Build Cache — Reuses the build outputs of any other Gradle build with the same inputs.
Gradle Daemon — A long-lived process that keeps building information “hot” in memory.
3. User experience
How to get started?
Step 1: Create the project outside the Desktop, Documents and Downloads folder to avoid all kinds of setup issues.
Step 2: Create a new project structure using an AEM archetype (using the latest archetype of the below example) you can also run on your current project if it follows the Adobe archetype:
Project Structure
Step 3: Run the following command to integrate AEM archetype with GAP:
Step 4: Provide AEM Jar and license details and other configurations:
sh gradlew config
Provide JAR Path
License Path
Service Pack path (AEM On-premise, AEM6.5)
Core components path
Environment COnfig
Step 5: Run the following command to start the new environment:
sh gradlew :env:setup
Or
sh gradlew
author and publisher envdocker setup running with the author and publisher
Step 6: Run the following command to deploy the code into your local instance:
sh gradlew :all:packageDeploy
package deploy completedRunning instance
Step 7: To stop the environment, you can use the following command:
sh gradlew down
Step 8: To start the environment, you can use the following command:
sh gradlew up
Issues:
If you have multiple project repos, then it’s hard to maintain multiple instances of AEM.
If you have dependency between repos, then incremental build might fail.
If you have installed ACS Commons and if live to reload the bundle or any bundles are in the installed state, then deploy might hang during the bundle stability check.
For more information on GAP plugin please visit the following documentation:
How to set up SonarQube profiles with AEM custom rules and configure them with local development?
Introduction:
SonarQube is an open-source platform developed by SonarSource for continuous inspection of code quality to perform automatic reviews with static analysis of code to detect bugs and code smells in 29 programming languages. SonarQube offers reports on duplicated code, coding standards, unit tests, code coverage, code complexity, comments, bugs, and security recommendations.
However, it does apply mainly to general Java issues. Adobe Experience Manager is a comprehensive content management platform for building websites, mobile apps and forms. This tool is intended to find common bugs and bad smells specific to AEM development.
Requirements:
Install the docker and keep it up to date
Step 1: Place the following docker-compose YML file under your project structure
Note: Docker image is based out of community image wttech (Cognified team)
Step 3: After running the command, it will take some time and once the sonar is up you will be able to see the running process in your Docker as shown below:
Docker container
Step 4: Visit the URL: http://localhost:9000/ for the first time and provide the credentials as
Username: admin
Password: admin
Startup page
Step 5: It will ask to change the password please provide the necessary details (Welcome1 preferable)
Step 1: Click on the Sonarlint plugin configuration as shown below:
SonarLint Config
Step 2: Configure the connection and provide the URL:
Sonar config
Step 3: Generate the token by going into your profile, providing the token name and creating the token or you can also select credentials to authenticate.
Token generation
Step 4: Once you are successfully logged in you will see the success message.
Connection success message
Step 5: Once you analyze the project it will show up the sonar rules based on the Sonaqube profile rules.
What is the best way to list all the children in AEM?
Stream-based VS page.listChildren VS Query Builder
Introduction:
AEM Sling Query is a resource traversal tool recommended for content traversal in AEM. Traversal using listChildren(), getChildren(), or the Resource API is preferable to writing JCR Queries as querying can be more costly than traversal. Sling Query is not a replacement for JCR Queries. When traversal involves checking multiple levels down, Sling Query is recommended because it involves lazy evaluation of query results.
JCR queries in AEM development and recommends using them sparingly in production environments due to performance concerns. JCR queries are suitable for end-user searches and structured content retrieval but should not be used for rendering requests such as navigation or content counts.
How can I get all the child pages in AEM using JCR Query?
List<String> queryList = new ArrayList<>();
Map<String, String> map = new HashMap<>();
map.put("path", resource.getPath());
map.put("type", "cq:PageContent");
map.put("p.limit", "-1");

Session session = resolver.adaptTo(Session.class);
Query query = queryBuilder.createQuery(PredicateGroup.create(map), session);
SearchResult result = query.getResult();
ResourceResolver leakingResourceResolverReference = null;
try {
    for (final Hit hit : result.getHits()) {
        if (leakingResourceResolverReference == null) {
            leakingResourceResolverReference = hit.getResource().getResourceResolver();
        }
        queryList.add(hit.getPath());
    }
} catch (RepositoryException e) {
    log.error("Error collecting inherited section search results", e);
} finally {
    if (leakingResourceResolverReference != null) {
        leakingResourceResolverReference.close();
    }
}
But JCR Query consumes more resources
AEM recommends using Page.listchildren because of less complexity
The AEM instance can slow down due to pending or stuck Sling jobs, and even after restarting the system, the queue may not be cleared due to various reasons. This article suggests ways to safely clear all the Sling jobs. How can clear all the sling jobs safely?
Introduction:
AEM is slowing down and restarting takes a long time because Sling Jobs remain pending or stuck due to various factors:
Shutdown during active job processing
The queue is stuck due to some write operations being blocked (high CPU / Indexing / high memory)
Other process threads are blocked.
Processing corrupt content or corrupt segment store or blob store
If your replication agent is broken due to a pending/stuck queue but the connection is working fine without a timeout, then it’s usually recommended to create a new agent and replace the broken publisher with the healthy publisher (which doesn’t have a pending queue) and disable the existing agent. But does this solve the queued jobs? No
Is there any other way I can stop jobs safely? Instead of cleaning up important sling jobs history?
Solution:
AEM OOTB comes with multiple tools in AEM and to access all the tools you need to navigate to the tool section and select the appropriate sections to perform all the operations
For example:
AEM operations
Managing templates
Cloud configurations
ACS Commons tools etc.
Tools are an essential part of AEM and avoid any dependency on Groovy scripts or any add scripts and can be managed or extended at any given time.
Creating a tool from scratch can be time-consuming and require man-hours, but generating a tool using a URL such as https://kiransg.com/2022/11/24/aem-tool-create-generate-tool-from-scratch/ can streamline the process. The generated tool, “Clear Out Excess Sling Jobs,” generate the model class, servlet, and other boilerplate code.
Generated files
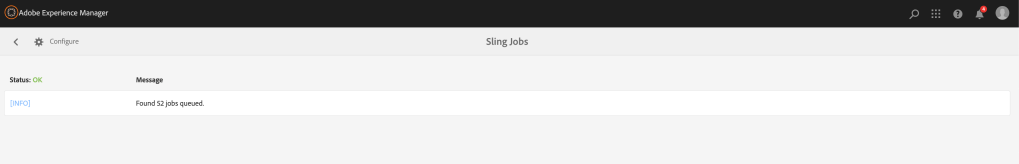
Generate a table of all the sling jobs and all the states based on all the registered topics in AEM and provide a search filter to find the sling job.
Once the sling model is deployed you would see the dashboard like this with all the jobs based on topics with all the states and actions:
sling Jobs report
Create a servlet which accepts topics to clear the jobs safely you need to use job stop and remove the jobs based on the Job ID as shown below:
Cleaning the job
After removing the job, refreshing the table may show the updated content. However sometimes the queued Jobs count might not change, this can be fixed by restarting the server but it’s not recommended.
In traditional content creation processes, authors may encounter challenges and obstacles that prevent them from creating high-quality content in a timely and efficient manner. These challenges can range from writer’s block to technical difficulties with the content management system. To address these challenges, there is a need for a solution that can provide real-time, contextual assistance to authors during the content creation process.
How can ChatGPT be effectively integrated with AEM to provide real-time, contextual assistance to content authors, and how can the adoption of this solution be encouraged among users to maximize its benefits?
Introduction:
ChatGPT is a large language model trained by OpenAI based on the GPT (Generative Pre-trained Transformer) architecture. I was designed to generate human-like responses to a wide range of natural language inputs. Essentially, I’m an AI chatbot that can converse with you on a variety of topics, from general knowledge questions to personal advice.
To address challenges, there is a need for a solution that can provide real-time, contextual assistance to authors during the content creation process. One potential solution is to integrate ChatGPT, an AI-powered chatbot, with Adobe Experience Manager (AEM), a leading content management system. By leveraging ChatGPT’s natural language processing capabilities, authors can receive instant and personalized guidance, support, and feedback throughout the content creation process, leading to higher-quality content creation and greater efficiency. However, the effectiveness of this approach will depend on how well the ChatGPT is trained, integrated, and adopted by the users.
How can I use ChatGPT for the teaser component to summarize a large content like title and description and link it article page?
You can get ChatGPT API key by visiting https://platform.openai.com/overview and going to your profile to create a new API key for your application
GPT Api key
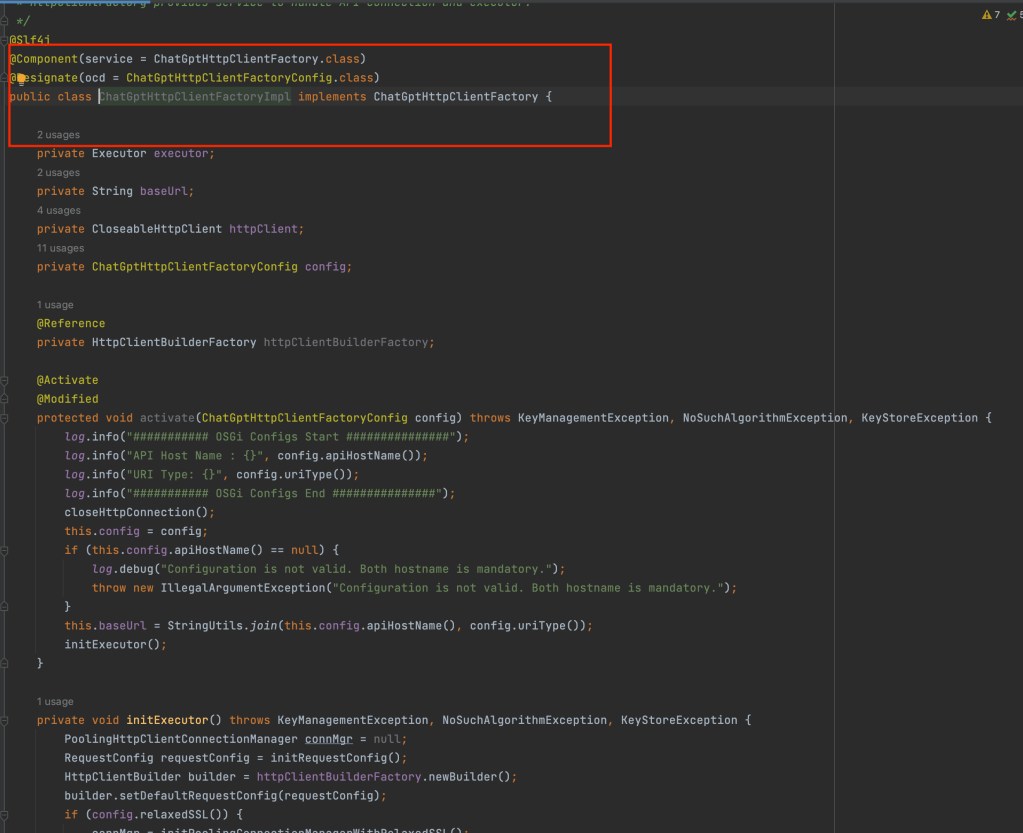
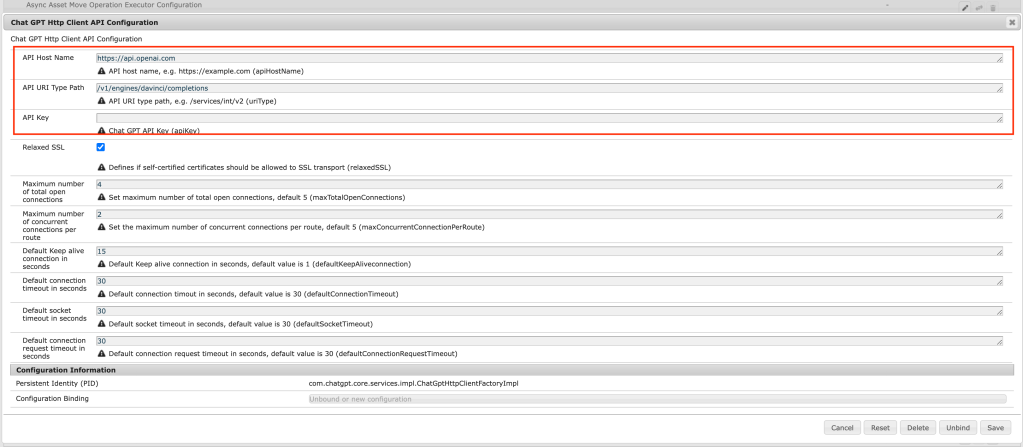
In order to use ChatGPT with AEM please create HttpClientFactory and OSGI config to configure endpoints and API key.
Client FactoryOSGi config for Chat GPT endpoint
Create an API invoker Service to prepare the request as shown below:
API invoker class
Create a Summary bean for preparing JSON body text:
Bean class
Create Teaser Servlet as shown below to read page title and description and generate Chat GPT summary by calling API invoker as shown below:
Servlet class
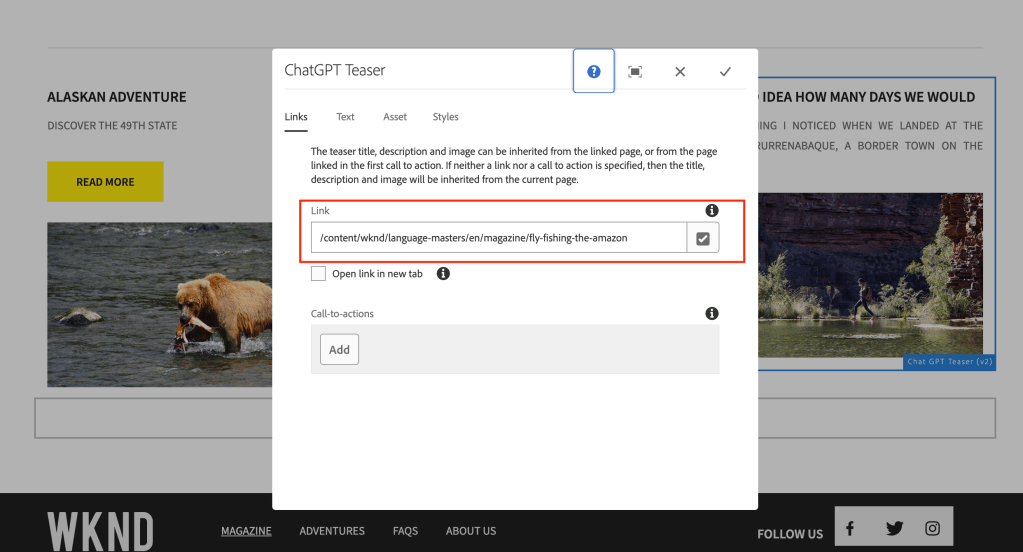
Create a gptTeaser component and override the editor JS to make a request to Teaser Servlet
Teaser dialog editor
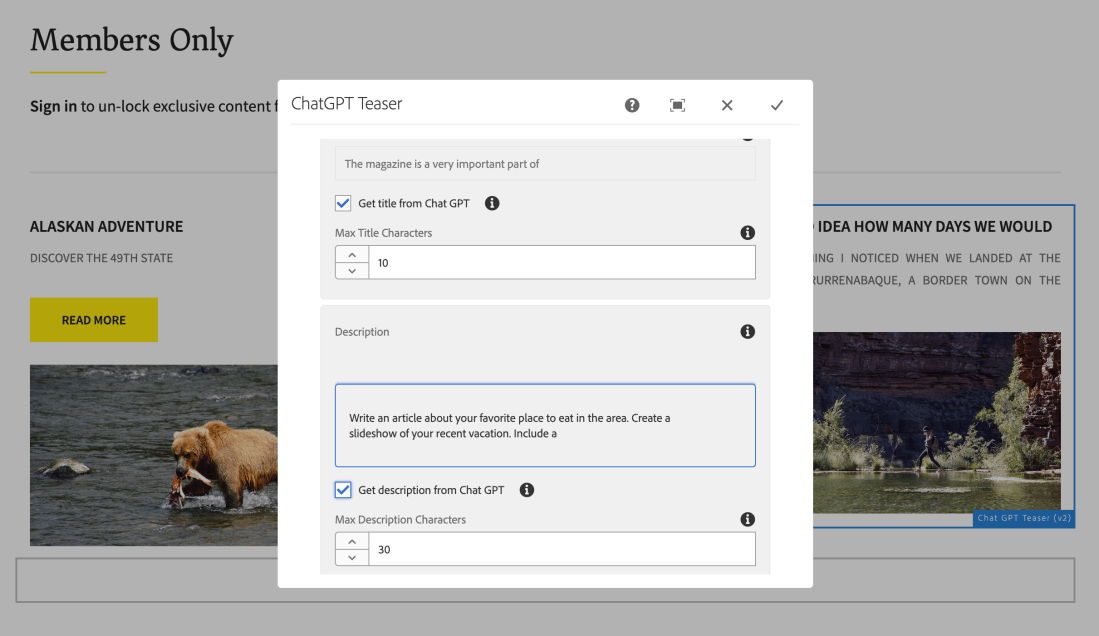
Open the GPT Teaser component and link to the page once you visit the Text tab you will be seeing a checkbox to get the title and description from Chat GPT and maximum tokens for summarization.
Teaser Link pageTeaser text tab
You can also uncheck the checkbox to edit the summarized content.
Linked page content with long title and description:
How to improve the authoring experience in AEM using SDI?
Can I optimize page load time?
Can I cache all experience fragments on the pages in AEM?
Introduction:
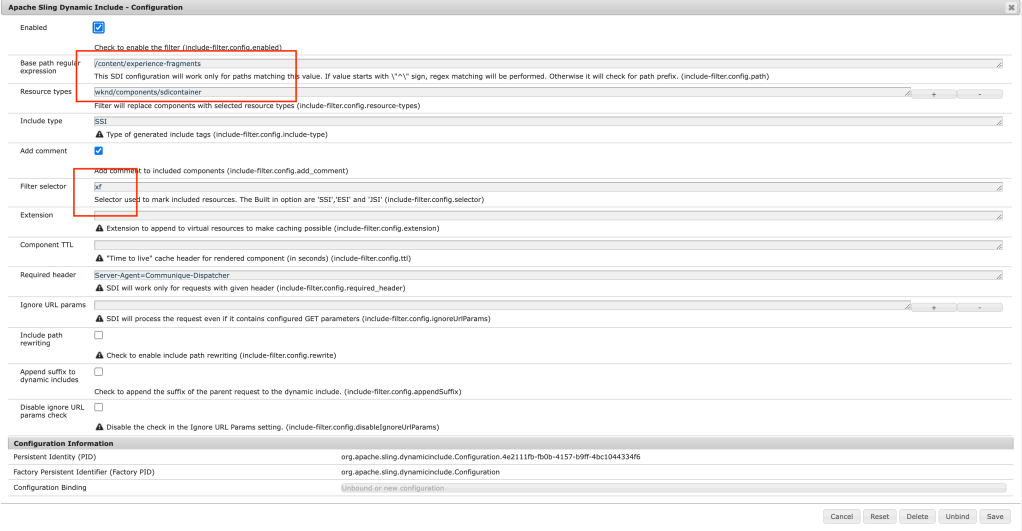
The purpose of the module presented here is to replace dynamically generated components (eg. current time or foreign exchange rates) with server-side include tags (eg. SSI or ESI). Therefore, the dispatcher is able to cache the whole page but dynamic components are generated and included with every request. Components to include are chosen in filter configuration using resourceType attribute.
When the filter intercepts a request for a component with a given resourceType, it’ll return a server-side include tag (eg. <!–#include virtual=”/path/to/resource” –> for the Apache server). However, the path is extended by a new selector (XF by default). This is required because the filter has to know when to return actual content.
Before going through this article please visit my other blog on Cache Experience Fragments in AEM Using Sling Dynamic Include all the simple customization to cache call the experience fragments on the page to improve page load time on published pages.
Flow diagram on the approach:
As part of this implementation, we are trying to cache all the experience fragments at different paths like /mnt/var/www/author/content/experience-fragment/{site-structure} as shown below:
Flow diagram author SDI approach
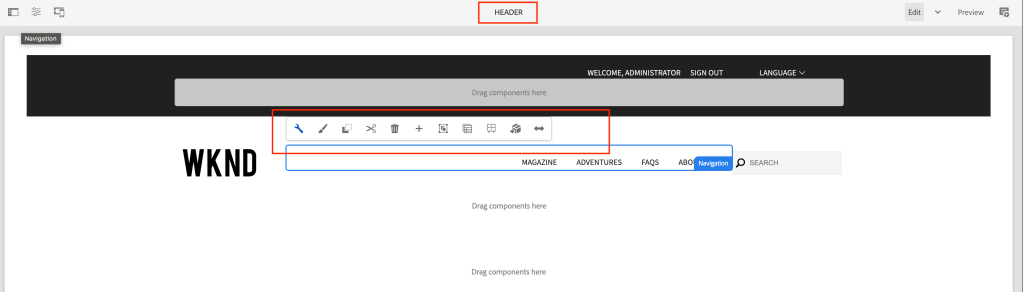
If SDI is enabled on the author:
On the local author instance all the experience fragments might disappear if the author instance is accessed on the local dispatcher or any lower environments as shown below:
wknd header is missing
After accessing the page on the dispatcher attached to the author the experience fragment might be broken and it would allow the components on the experience fragment can be authored directly from the page (kind of new feature) but it would break if any permissions of authoring on header/footer etc.
wknd header is editable on the page
Override the wrapper component:
If it is a Layout container, then please override the responsivegrid.html by copying responsivegrid.html from wcm/foundation/components/responsivegrid the as shown below:
If it is a Core Container component please override the responsivegrid.html and allowedcomponents.html by copying responsivegrid.html and allowedcomponents.html from core/wcm/components/container and the as shown below:
With the above fix, the experience fragment component won’t break and won’t be authorable on the page and works as expected.
wknd page working
What about the experience fragment page? It’s not authorable, because of the wcmmode=’disabled’ parameter in sightly
unable to edit component
To fix the above issue Create a sling model as shown below:
This model class replaces the wrapper component with Synthetic Resource pointing to the layout container or core container component, which will avoid SDI picking based on the resourcetype
Override body.html by copying the body.html from cq/experience-fragments/components/xfpage of the experience fragment page component and add the following code:
Finally, with the above fix, the experience fragment page is editable, and SDI include statement will disappear on the experience fragment page.
Finally component is editable
To clear the cache you need to add /author/content/{experience-fragment} path to acs commons dispatcher cache clear path
Advantages of caching Experience fragment at common or shared location:
Increases initial page load – response time based on the number of XF on the page
Improves overall page load time
Better debugging SDI functionality – whenever the XF page is updated and published it removes from the cache and on a new page request a new cache is created and used on subsequent requests
Cache all the experience fragments in AEM under a common or shared location on the dispatcher to load dynamically whenever the XF page is activated.
Improve initial page load performance on subsequent requests on the same or similar pages.
Introduction:
The purpose of the module presented here is to replace dynamically generated components (eg. current time or foreign exchange rates) with server-side include tags (eg. SSI or ESI). Therefore the dispatcher is able to cache the whole page but dynamic components are generated and included with every request. Components to include are chosen in filter configuration using resourceType attribute.
When the filter intercepts a request for a component with a given resourceType, it’ll return a server-side include tag (eg. <!–#include virtual=”/path/to/resource” –> for Apache server). However, the path is extended by a new selector (XF by default). This is required because the filter has to know when to return actual content.
Components don’t have to be modified in order to use this module (or even be aware of its existence). It’s a servlet filter, installed as an OSGi bundle and it can be enabled, disabled, or reconfigured without touching the CQ installation.
Flow diagram on the approach:
As part of this implementation, we are trying to cache all the content paths i.e., /var/www/html/publish/content/{site-structire} and experience fragments at different paths like /var/www/html/publish/content/experience-fragment/{site-structure} as shown below:
SDI flow
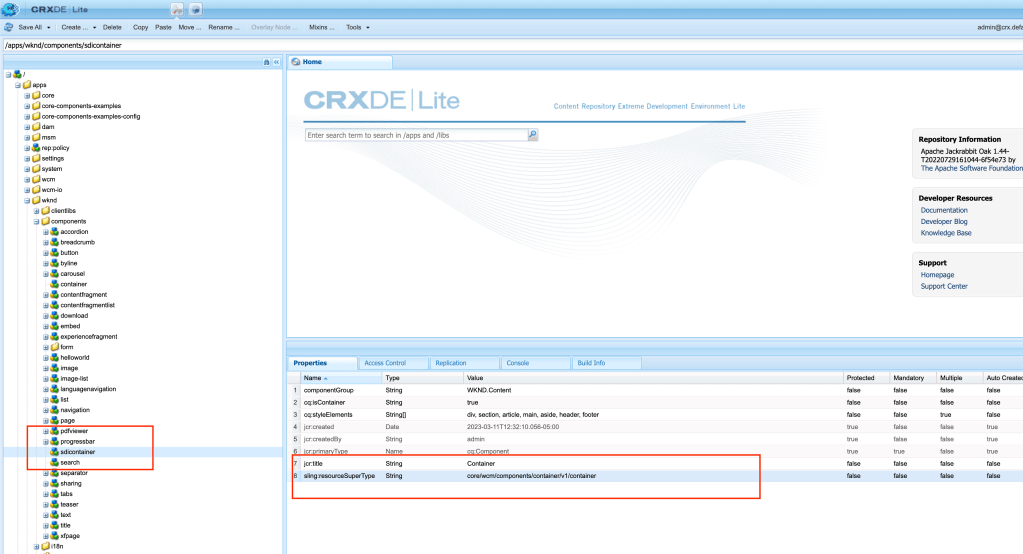
Create a wrapper component as shown below:
If Container then create a wrapper container component sling:resourceSupertype = core/wcm/components/container/v1/container
If Layout container then create wrapper responsivegrid component sling:resourceSupertype = wcm/foundation/components/responsivegrid
Wrapper component
Update all the XF pages container/layout container components as shown below:
Update only the first container resourcetype under root node to the newly created wrapper component
Update XF page
Update the XF template as shown below:
Update both initial content and structure content, only the first container resourcetype under the root node to the newly created wrapper component
Once the page is loaded you will be seeing following SDI include message as shown below on the publisher:
SDI message on publisher
SDI loading on dispatcher port 8080
SDI on Dispatcher
You can verify cache folder for results:
Cached SDI
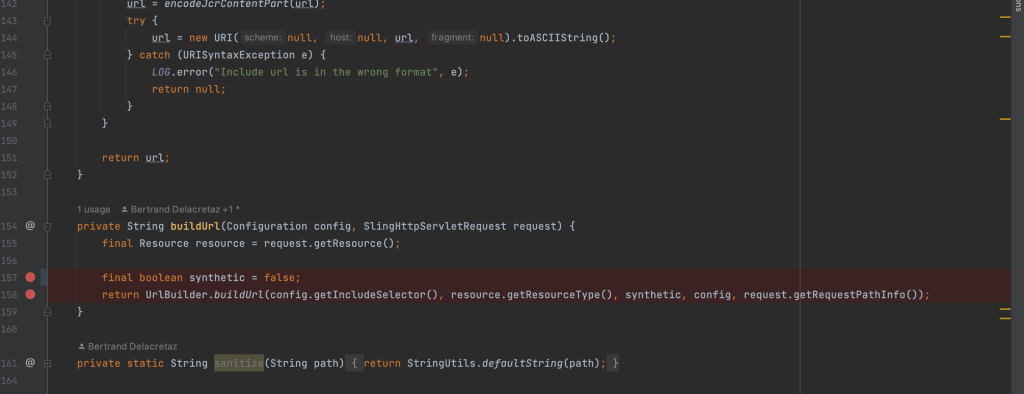
If SDI includes path appends resourcetype, then clone the SDI repo and update the code as shown below:
SDI issue
Open the IncludeTagFilter.java as shown below and update the code at synthetic variable to false:
SDI code fix
Run mvn clean install to generate the new jar file and install directly on the publish server or include the external jar dependency on maven
Advantages of caching Experience fragment at common or shared location:
Increases initial page load – response time based on the number of XF on the page
Decreases the Dispatcher cache size – based on the number of XF components on the page
Improves overall page load time
Better debugging SDI functionality – whenever the XF page is updated and published it removes from the cache and on a new page request a new cache is created and used on subsequent requests
Decreases CPU utilization
Credits: I was able to finish this blog with help of my friend
Delete all the assets which don’t have references to improve AEM performance in turn Indexes and search/query performance.
Introduction:
How do assets get published?
The author uploads the images and publishes the assets
Create a launcher and workflow which processes assets metadata and publishes the pages
Whenever we publish any pages and if the page has references to assets, then during publishing, it asks to replicate the references as well.
What happens when the page is unpublished?
When the page is deactivated, assets referenced to the page will not be deactivated because this asset might have reference to the other pages hence out of the box assets won’t be deactivated.
If we perform cleanup, deactivate and delete old pages, we might not be cleaning up assets related to this page.
What advantages of cleaning up of old assets?
Drastically reduces repository size
Improves DAM Asset search
Improves indexing
Generate Published Asset Report by visiting:
Go to Tools -> Assets -> Reports as shown below:
Asset Report Tool Section
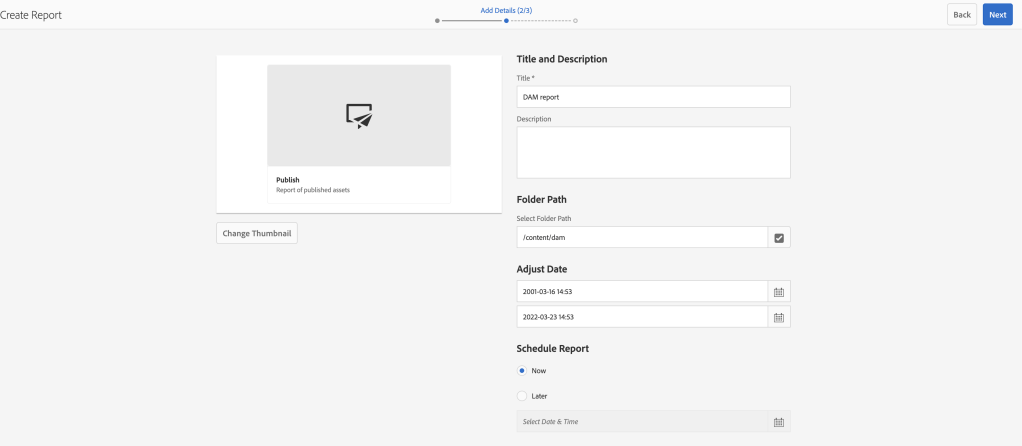
Click on create and click on Publish report
Asset Publish Report
Provide folder path and start date and end date
Asset Report Configure Page
Select the columns as per the requirement
Asset Report Custom Column Page
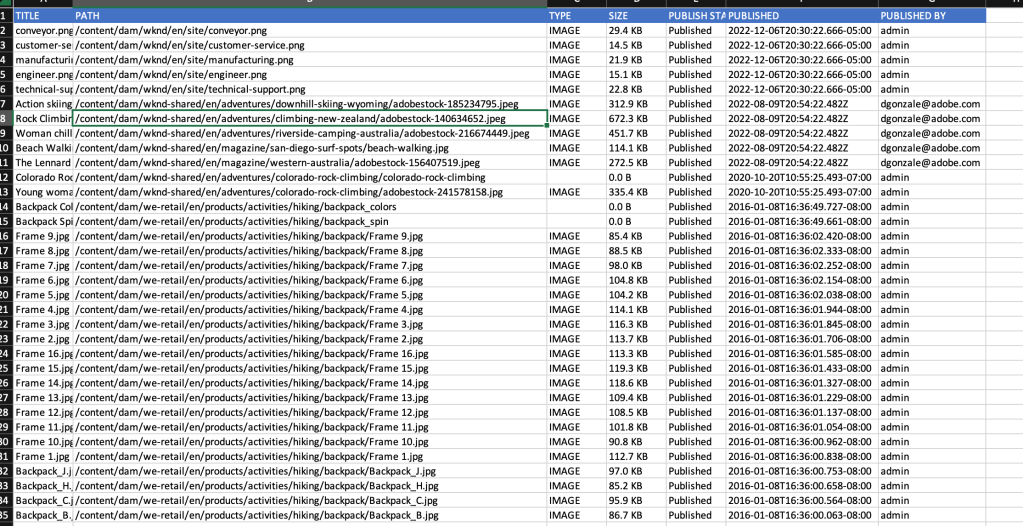
Finally, the report will be ready with all the assets lists as shown below
Asset Report
Download the report to see the final list of images
DAM Report result
To generate the report let’s create a new AEM tool:
AEM OOTB comes with multiple tools in AEM and to access all the tools you need to navigate to the tool section and select the appropriate sections to perform all the operations
For example:
AEM operations
Managing templates
Cloud configurations
ACS Commons tools etc..
Tools are an essential part of AEM and avoid any dependency on Groovy scripts or any add scripts and can be managed or extended at any given point in time.
Broken Asset Report generates a report of all the unreferenced assets by running a Reference Search query across the repository every 30s (by default), you can update the scheduler expression based on your repository size.
The scheduler also checks for the CPU/HEAP size before triggering the reference search process and for more details on Throttled scheduler please refer to the link.
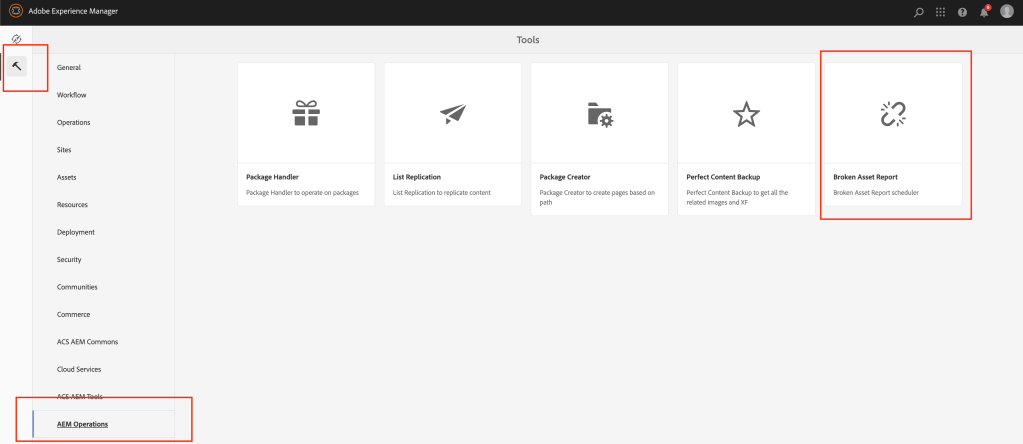
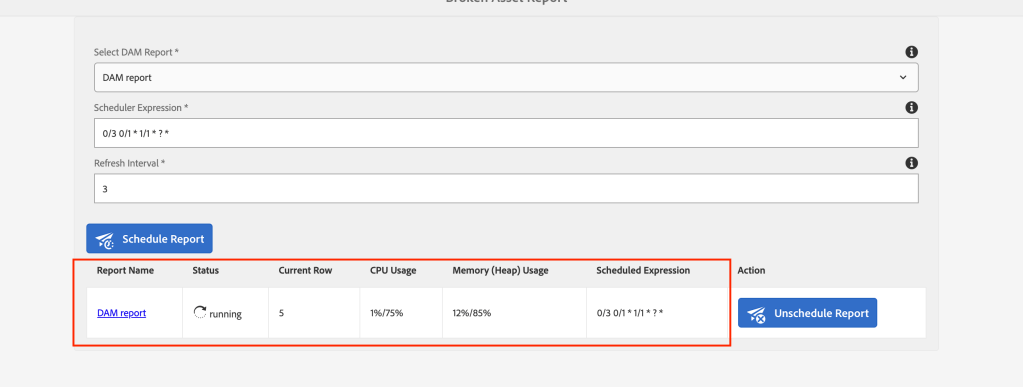
Once the repository is built and deployed, you will be able to access the Broken Asset Reference report as shown below:
Broken Asset Reference Tool Section
You can select the report just now created by you in the drop down as shown below:
Select the Asset Report from dropdown
Provide scheduler expression as per your needs and select the result refresh interval for every 10s or as per your needs
You can see the results as shown below once the process is kicked off and it will also show the current row its processing and also CPU/Heap usage.
Reference Search Running status
For some reason, if your system CPU/Heap is throttling then from the backend it takes care of not running your scheduler or you can also manually unschedule the scheduler.
Once your system’s CPU comes back to normal you can go back and select the report and schedule again and report generation picks from the current row where it was left off.
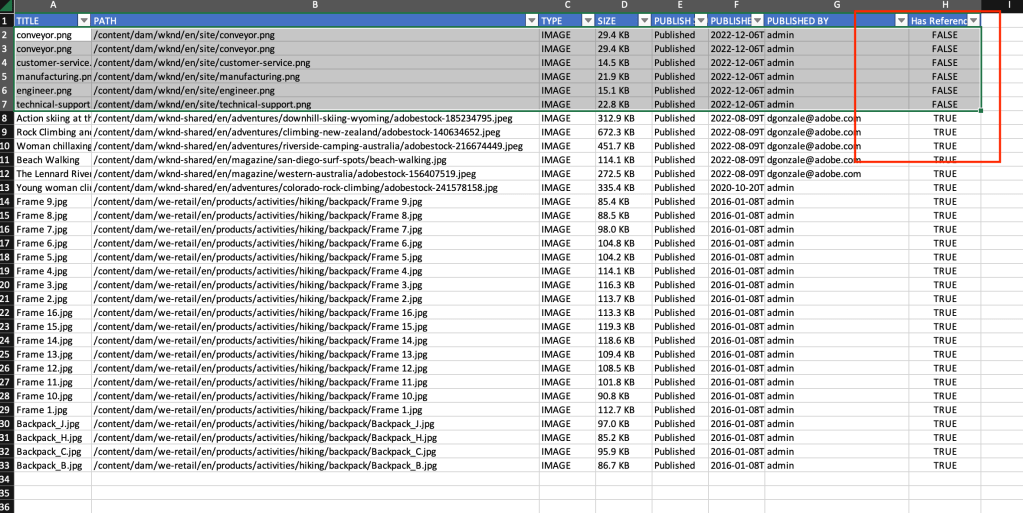
Once the processing is complete click on the report name to download the generated report.
Reference Search Completed StatusReport Excel with Has reference Column
Generate the Splunk (logs) results by running a query to get all the assets to call (/content/dam) requests on dispatcher/publisher from the past 1year or so.
You can also reach out to the Analytics team, requesting image impressions (data on image usage) from the past 1 year or so.
Please provide your valuable feedback in the comments.
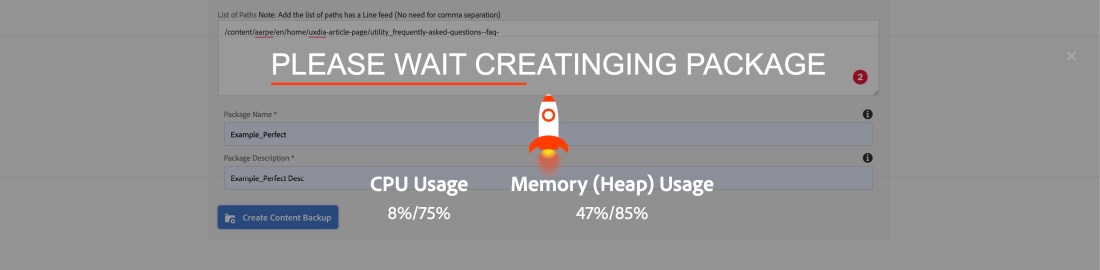
As a developer or user, I would like to make an informed decision by fetching the AEM system CPU/Heap status before or while running a process.
Introduction:
Use cases for developers:
Infinite loops – a coding error
Garbage collection is not handled – unclosed streams
An exception like out of bound issue
Heap size issue – saving loads of data or declaring/manipulating too many strings
Java MX Bean is an API that provides detailed information on JVM CPU/MEM (Heap) status.
A platform MXBean is a managed bean that conforms to the JMX Instrumentation Specification and only uses a set of basic data types. A JMX management application and the platform MBeanServer can interoperate without requiring classes for MXBean specific data types. The data types being transmitted between the JMX connector server and the connector client are open types and this allows interoperation across versions. See the specification of MXBeans for details.
As developer before running or while running any bulk process or schedulers, it’s always better to get system information.
ThrottledTaskRunnerStats Service:
Create ThrottledTaskRunnerStats service as shown below:
package com.aem.operations.core.services;

import javax.management.InstanceNotFoundException;
import javax.management.ReflectionException;

/**
 * Private interface for exposing ThrottledTaskRunner stats
 * **/
public interface ThrottledTaskRunnerStats {
    /**
     * @return the % of CPU being utilized.
     * @throws InstanceNotFoundException
     * @throws ReflectionException
     */
    double getCpuLevel() throws InstanceNotFoundException, ReflectionException;

    /**
     * The % of memory being utilized.
     * @return
     */
    double getMemoryUsage();

    /***
     * @return the OSGi configured max allowed CPU utilization.
     */
    double getMaxCpu();

    /***
     * @return the OSGi configured max allowed Memory (heap) utilization.
     */
    double getMaxHeap();

    /**
     * @return the max number of threads ThrottledTaskRunner will use to execute the work.
     */
    int getMaxThreads();
}
ThrottledTaskRunnerImpl Service Implementation:
Create ThrottledTaskRunnerImpl service implementation as shown below:
package com.aem.operations.core.services.impl;

import java.lang.management.ManagementFactory;
import javax.management.Attribute;
import javax.management.AttributeList;
import javax.management.AttributeNotFoundException;
import javax.management.InstanceNotFoundException;
import javax.management.MBeanException;
import javax.management.MBeanServer;
import javax.management.MalformedObjectNameException;
import javax.management.ObjectName;
import javax.management.ReflectionException;
import javax.management.openmbean.CompositeData;
import com.aem.operations.core.services.ThrottledTaskRunnerStats;
import org.osgi.service.component.annotations.Activate;
import org.osgi.service.component.annotations.Component;
import org.osgi.service.component.annotations.Modified;
import org.slf4j.Logger;
import org.slf4j.LoggerFactory;

@Component(service = ThrottledTaskRunnerStats.class, immediate = true, name = "Throttled Task Runner Service Stats")
public class ThrottledTaskRunnerImpl implements ThrottledTaskRunnerStats {

    private static final Logger LOGGER = LoggerFactory.getLogger(ThrottledTaskRunnerImpl.class);
    private final MBeanServer mbs = ManagementFactory.getPlatformMBeanServer();
    private ObjectName osBeanName;
    private ObjectName memBeanName;

    @Activate
    @Modified
    protected void activate() {
        try {
            memBeanName = ObjectName.getInstance("java.lang:type=Memory");
            osBeanName = ObjectName.getInstance("java.lang:type=OperatingSystem");
        } catch (MalformedObjectNameException | NullPointerException ex) {
            LOGGER.error("Error getting OS MBean (shouldn't ever happen) {}", ex.getMessage());
        }
    }

    @Override
    public double getCpuLevel() throws InstanceNotFoundException, ReflectionException {
        // This method will block until CPU usage is low enough
        AttributeList list = mbs.getAttributes(osBeanName, new String[]{"ProcessCpuLoad"});

        if (list.isEmpty()) {
            LOGGER.error("No CPU stats found for ProcessCpuLoad");
            return -1;
        }

        Attribute att = (Attribute) list.get(0);
        return (Double) att.getValue();
    }

    @Override
    public double getMemoryUsage() {
        try {
            Object memoryusage = mbs.getAttribute(memBeanName, "HeapMemoryUsage");
            CompositeData cd = (CompositeData) memoryusage;
            long max = (Long) cd.get("max");
            long used = (Long) cd.get("used");
            return (double) used / (double) max;
        } catch (AttributeNotFoundException | InstanceNotFoundException | MBeanException | ReflectionException e) {
            LOGGER.error("No Memory stats found for HeapMemoryUsage", e);
            return -1;
        }
    }

    @Override
    public double getMaxCpu() {
        return 0.75;
    }

    @Override
    public double getMaxHeap() {
        return 0.85;
    }

    @Override
    public int getMaxThreads() {
        return Math.max(1, Runtime.getRuntime().availableProcessors()/2);
    }
}
CPU Status Servlet:
Create a CpuStatusServlet based on the path as shown below:
AEM Bulk Replication allows you to activate a series of pages and/or assets.
How can we make sure workflow won’t impact AEM performance (CPU or Heap memory) / throttle the system?
Introduction:
AEM bulk replication or activation is performed on a series of pages and/or assets. We usually perform bulk replication on tree structures or lists of paths.
Use case:
MSM (Multi-site management) – rolling out a series of pages or site
Editable template – add/remove new components on template structure and activate existing pages
Bulk Asset ingests into the system
Bulk redirect//vanity path update
ACS Commons Throttled Task Runner is built on Java management API for managing and monitoring the Java VM and can be used to pause tasks and terminate the tasks based on stats.
Throttled Task Runner (a managed thread pool) provides a convenient way to run many AEM-specific activities in bulk it basically checks for the Throttled Task Runner bean and gets current running stats of the actual work being done.
OSGi Configuration:
The Throttled Task Runner is OSGi configurable, but please note that changing configuration while work is being processed results in resetting the worker pool and can lose active work.
Throttled Task Runner OSGi
Max threads: Recommended not to exceed the number of CPU cores. Default 4.
Max CPU %: Used to throttle activity when CPU exceeds this amount. Range is 0..1; -1 means disable this check.
Max Heap %: Used to throttle activity when heap usage exceeds this amount. Range is 0..1; -1 means disable this check.
Cooldown time: Time to wait for CPU/MEM cooldown between throttle checks (in milliseconds)
Watchdog time: Maximum time allowed (in ms) per action before it is interrupted forcefully.
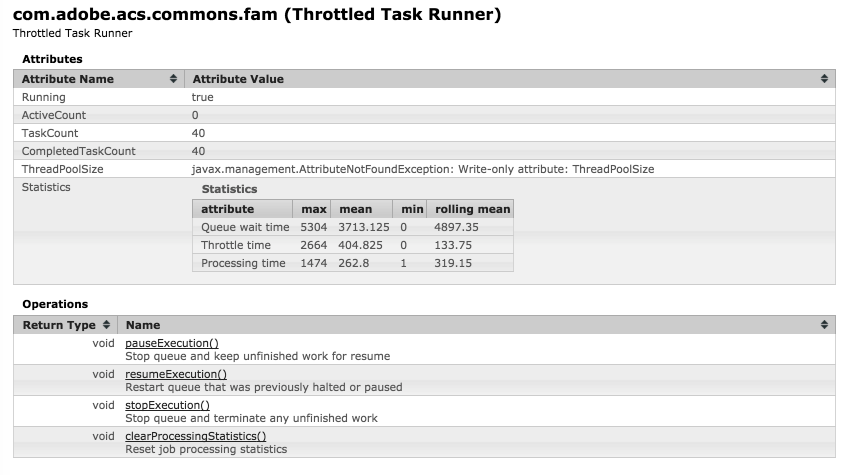
JMX MBeans
Throttled Task Runner MBean
This is the core worker pool. All action managers share the same task runner pool, at least in the current implementation. The task runner can be paused or halted entirely, throwing out any unfinished work.
Throttled task runner JMX
How to use ACS Commons throttled task runner
Add the following dependency to your pom
Create a custom service or servlet as shown below:
Throttled Replication
inside the custom workflow process method check for the Low CPU and Low memory before starting your task to avoid performance impact on the system.